This article discusses the use of Machine Learning (ML) for product categorization in derivatives. It starts by introducing the two traditional methods of classifying financial products: mapping product codes from different taxonomies and analyzing the product structure through rules. Both methods have their own challenges and limitations.
Product Categorization
With the pressures around regulatory compliance only continuing to intensify, the critical role played in the reporting of financial transactions by product category codes has come into even sharper focus with the upcoming publication of a Unique Product Identifier (UPI).
Product categorization involves comparing products that may be structurally very similar in 99% of their features – it is the remaining 1% that makes them distinct. From the perspective of a regulator, the categorization facilitated by these codes – or taxonomies – facilitates at once data aggregation, transparency through the ability to query that data, and the extraction of risk measures.
There were two main methods for product categorization:
- Mapping product codes from different taxonomies.
- Analyzing structure through rules.
Mapping product codes
Mapping codes for different product types between different taxonomies – is a difficult and costly task. Sometimes the definitions of the codes are not clear or precise, at which point it becomes difficult to compare the meanings of codes across different taxonomies. Moreover, those taxonomies may also use different levels of granularity, making a one-to-one mapping difficult between the codes. For example the ISDA taxonomy in most asset classes is more granular than the CFI.
An example: ISDA Taxonomy vs CFI
Zero coupon, plain vanilla and OIS sit at the same level within the CFI and therefore would all be categorized identically with the first three characters of SRC, thus providing no ability for regulators to distinguish between these products to enable a useful analysis[1].
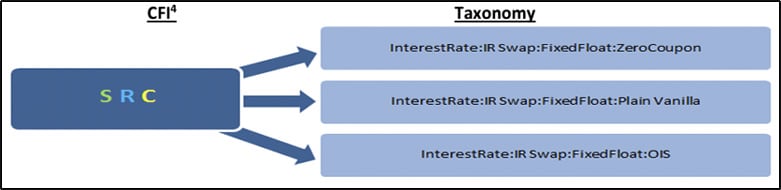
Figure 1. Mapping between CFI and ISDA taxonomy applying to the case of Zero coupon, plain vanilla and OIS.
CFI4 : S=Swaps; R=Rates; C=Fixed-Floating
Analyzing the structure
Analyzing the structure of a product allows the appropriate product type code to be assigned; this also entails analyzing some of the values inside the message – for example, analyzing the floating rate index of a swap to determine whether it is an OIS swap. It requires deep domain knowledge to define the rules that distinguish products between them. In addition, there is a lot of complexity involved in making sure that the rules don’t overlap and that a product can’t fall into multiple categories.
Using Machine Learning for categorizing derivatives
In this article we present a third approach for accomplishing product categorization, Machine Learning (ML). We train a machine learning framework to be able to categorize OTC derivative products by itself. We are seeking to accomplish these main objectives with this approach:
- Research and find the best existing machine learning framework for derivative product categorization.
- Find the minimum set of transactions needed to train the framework effectively.
- Identify challenges and opportunities using Machine Learning for product categorization.
The solution has been implemented using Python as the primary programming language. In the process of building the machine learning models, we have used popular machine learning open-source frameworks such as PyTorch and TensorFlow to create, train, and evaluate our machine learning models. Additionally, we have employed libraries like NumPy, pandas, and scikit-learn for data manipulation, analysis, and preprocessing.
Building the trade data set for training
This project uses FpML[2] as the data format for creating the training set. The main reason for using FpML is that it is widely used in the OTC derivatives industry as many financial institutions and service providers use it to represent derivative transactions data, internally and externally.
To train the ML frameworks, 260 FpML trades have been previously categorized and an ISDA Taxonomy 2.0 Asset Class value is assigned to each trade. The current trades that can be categorized cover Credit, Interest Rate, Equity, Commodity and Foreign Exchange asset classes. Samples include different product features covering a significant number of ISDA Taxonomy categories. The taxonomy label assigned to each FpML trade serves as the target variable. The representation per asset class has been the following one:
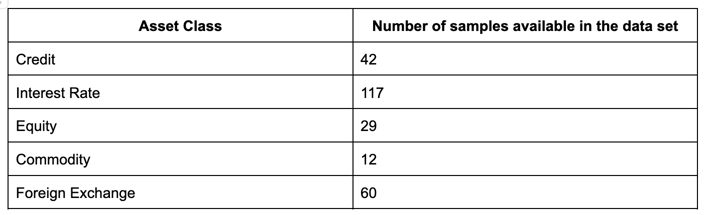 Table 1. Number of samples per asset class out of a total of 260.
Additionally, the categorized FpML data has been transformed into a boolean list, where each position refers to the existence of an FpML element/tag. The list is populated with 1 if the FpML element is present in the original sample, otherwise, is set to 0.
Thus, our training set is formed by the product label arising from the classification of the FpML sample, and the boolean values containing the existence or not of certain FpML tags. With the aim to reduce the high dimensions of the resulting matrix, the data has been cleaned performing a filtering based on the correlation between the presence of an FpML tag and the product categorization. Based on these criteria, only the FpML tags having the strongest correlation with the product label are kept in the dataset, and considered as predictors to perform the classification. This resulted in 25 tags.
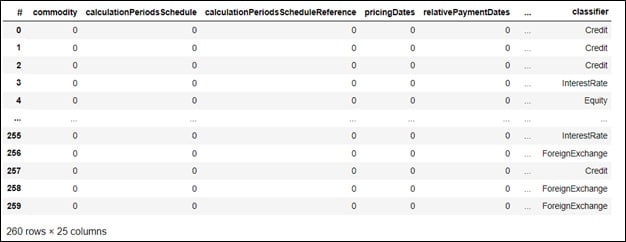
Figure 2. Training data set representation. The first column displays the sample number out of the 260 considered. The subsequent columns contain boolean values for certain FpML tags, and indicate whether the tag is present in the sample or not. The last column contains the product taxonomy label assigned for each sample.
In addition, to train the models, we split the 260 entries into a training set with 80% of the samples (208 samples) and a testing set with the remaining 20% (52 samples). After training, the model is evaluated using the test set to assess its performance.
Finding the right Machine Learning framework
The initial research focused on finding the most appropriate Machine Learning framework for categorizing derivative transactions. We researched the 5 frameworks below, training them with the preprocessed data set shown in Figure 2:
- DecisionTree
- RandomForest
- Support Vector Machine (SVM)
- Neural Network using PyTorch (NN_PyTorch)
- Neural Network using TensorFlow (NN_TensorFlow)
To evaluate and compare their performances, we use the following classification metrics:
- Accuracy: measures how often a machine learning model makes correct predictions. It is the ratio of correctly predicted instances to the total instances.
- Precision: measures the accuracy of positive predictions. It is the ratio of true positives to all positive predictions made by the model.
- Recall: measures the ability of a model to identify all relevant instances. It is the ratio of true positives to all actual positive instances.
| Taxonomy metrics | DecisionTree | RandomForest | SVM | NN_PyTorch | NN_Tensorflow |
|---|---|---|---|---|---|
| Accuracy | 96% | 96% | 96% | 96% | 96.15% |
| Precision | 98% | 97% | 97% | 97% | 96% |
| Recall | 96% | 96% | 96% | 96% | 96% |
| F1-Score | 97% | 96% | 96% | 96% | 96% |
Table 2. Performance metrics (Accuracy, Precision, Recall and F1-Score) obtained for each of the predictive algorithms (DecissionTree, Random Forest, SVM, NN_PyTorch, NN_Tensorflow) expressed as percentages.
As shown in Table 2, all the models considered have achieved high levels of performance. It must be noted the strong results of the Decision Tree, a fact even more remarkable given the simplicity of this algorithm compared to the others.
Despite the exceptional performance of all of them, additional testing phases will be run to verify that the metrics are maintained when facing new unseen data. Certainly, these high scores indicate that the models have been well-trained on the training samples, but they could still be overfitted.
Overfitting occurs when a model learns to perform exceptionally well on the training data but struggles to make accurate predictions on new, unseen data. To mitigate overfitting, various techniques, such as regularization methods, cross-validation, and early stopping, are typically applied during model training.
One critical factor in addressing overfitting is the size and diversity of the training dataset. If the training dataset is small and not representative of the broader population or potential inputs, the model may not generalize effectively. In such cases, having more diverse and representative training samples can significantly improve a model's ability to make accurate predictions on new data.
In acknowledgment of all these factors, we can conclude that all the algorithms have obtained high metric scores in this initial approach. Conscious of the limited size of the training dataset and the overfitting phenomenon, these promising results encourage us to proceed with the next phases of the project, involving a more extended training and a testing phase including separate validation datasets. This will ensure that the model can generalize well beyond the training data and perform accurately on diverse and previously unseen inputs. This is especially important for asset classes with limited representation, such as commodities (with only 12 samples) or Equity (with 29 samples).
Implementation
We developed a very simple classification application supporting the 5 different ML frameworks. The application ingests an FpML trade and it classifies it using the different ML frameworks. The output of the app is the predicted asset class and prediction probability for each ML model:
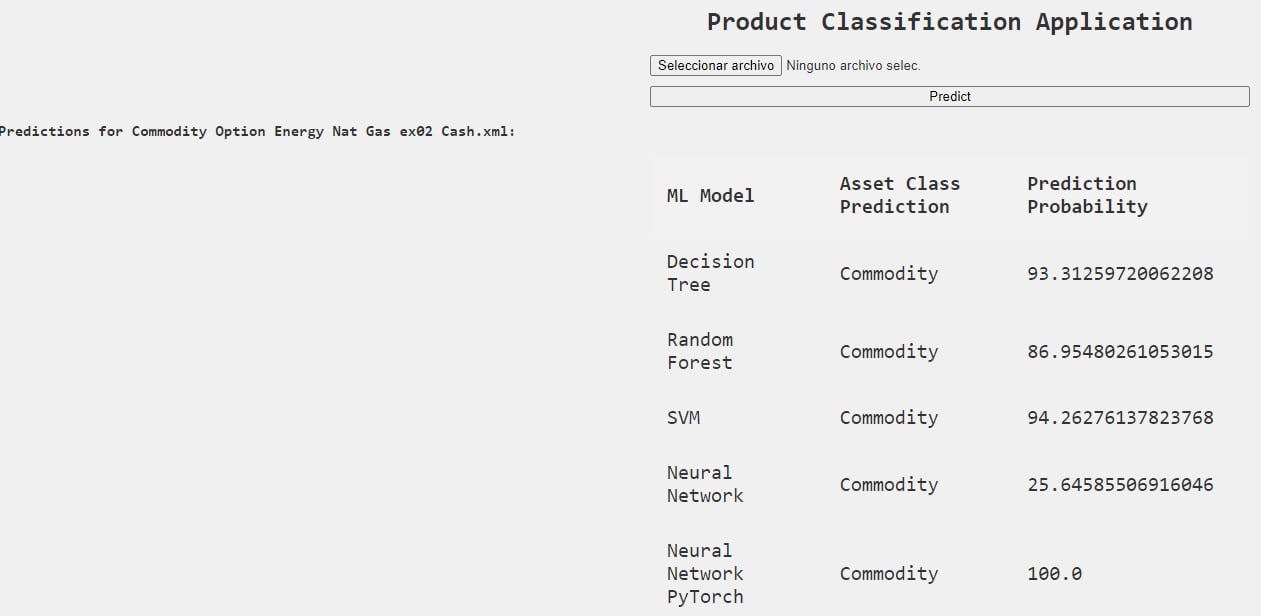
Figure 3. Screenshot of the Product Classification Application
Challenges and opportunities
There are other areas of future work that we would like to focus on in upcoming phases of the project:
- Expanding the data set to cover more product features. This will allow us to use the ML frameworks to classify at the specific product type level, not only at the asset class level.
- Research on whether there are frameworks that are more appropriate for classifying specific asset classes.
- Categorization of Exotic/Structured products - we think this will present challenges to the ML frameworks since there is much more product variation. On the other hand, a well-trained framework may provide huge value to financial institutions since categorization of exotic and structured products is highly complex and error-prone.
- Expanding the data set with other data formats such as CDM and ISO 20022. We think a similar implementation can also be applied to other industry standards with similar results.
Conclusions
Machine learning presents tremendous opportunities in solving complex problems that the financial industry faces. Standard ML frameworks already provide a good basis for solving some of these problems. With a minimum data set the ML frameworks are capable of categorizing derivative transactions effectively, with different metrics such as accuracy and precision, between 96 to 98%. We think these are very promising results and encourage us to further work on this area.
[1]https://www.iosco.org/library/pubdocs/541/pdf/International%20Swaps%20and%20Derivatives%20Association%20(ISDA).pdf
[2] FpML website: https://www.fpml.org